How to build an observability pipeline for blockchain data infrastructure using OpenTelemetry. Covers metrics, logs, and traces for Solana trading bots and node operators to detect stale feeds and pipeline failures.
Blockchain Data Observability: When Your Data Pipeline Goes Offline
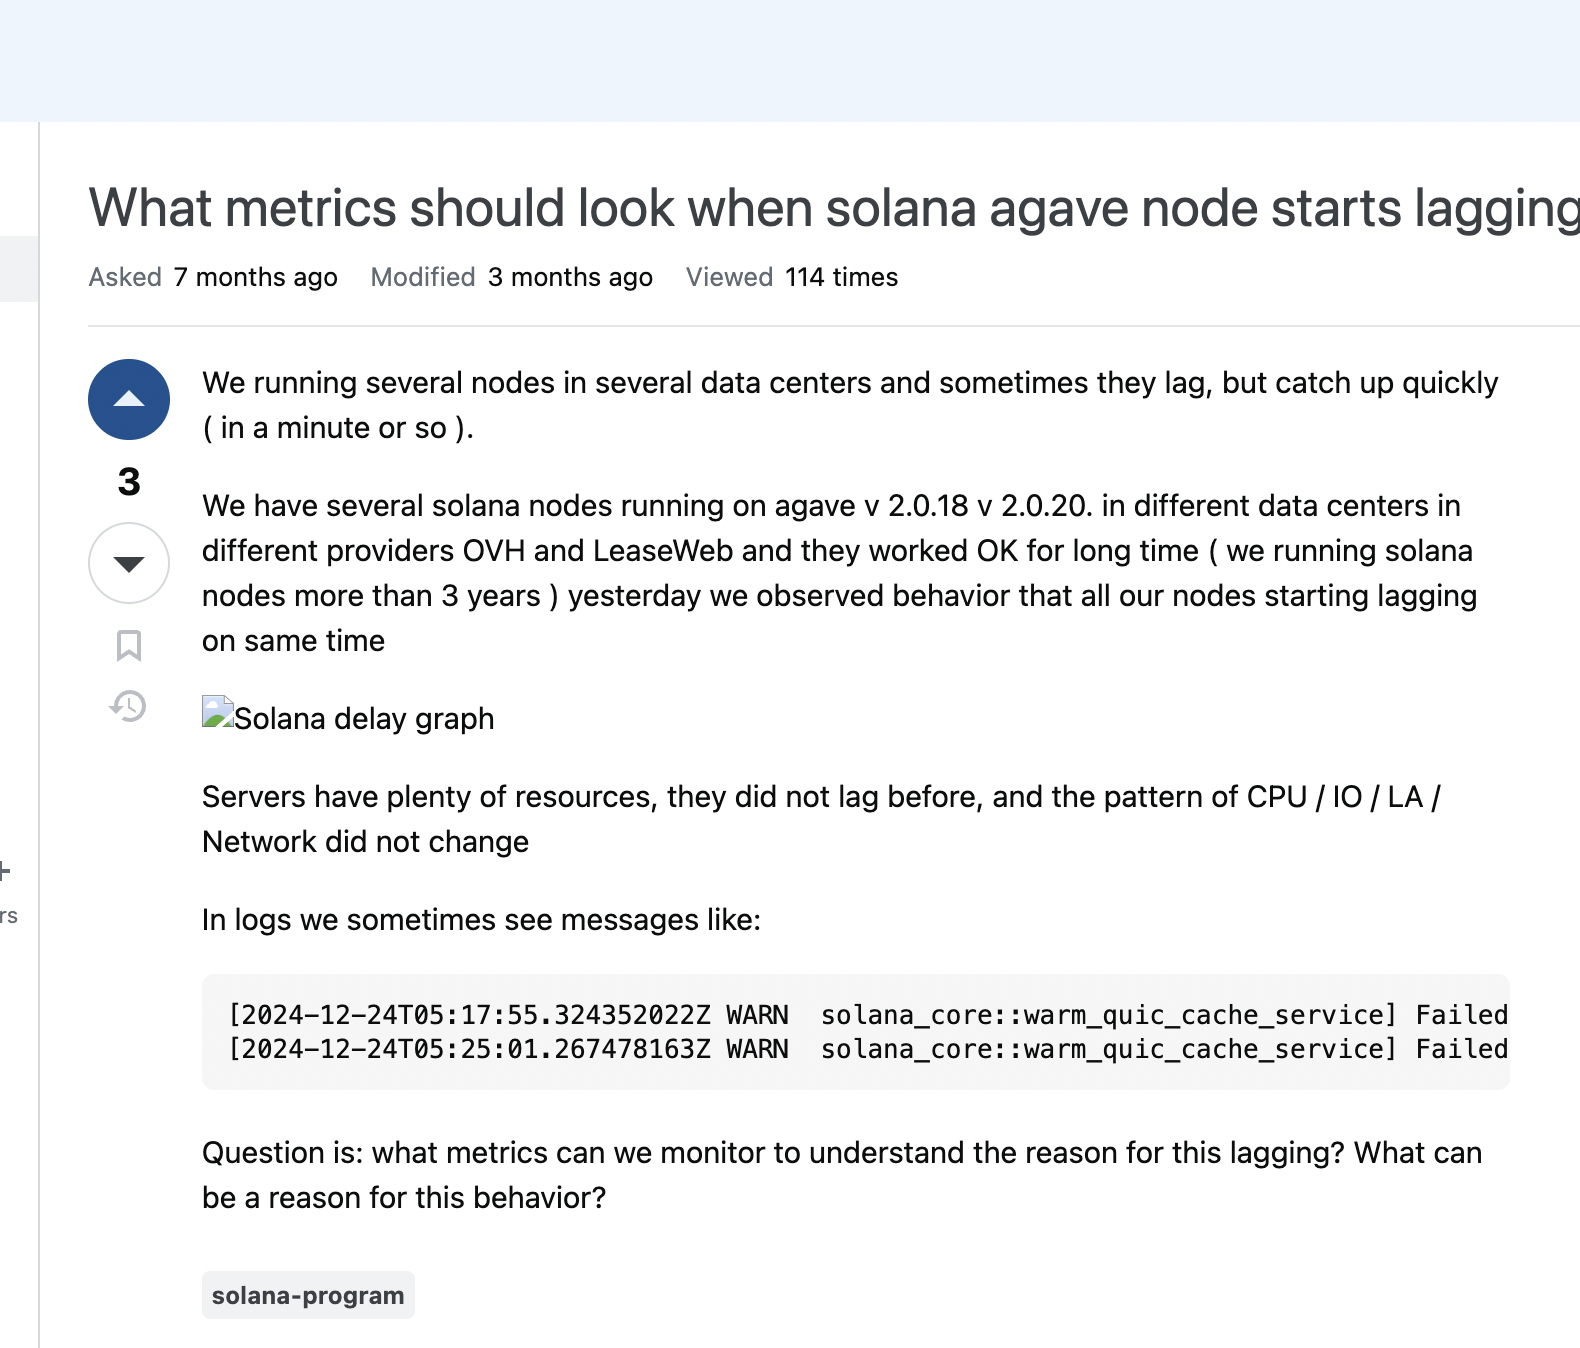
You’re running a Solana trading bot that depends on real-time, low-latency price feeds. Suddenly, your dashboard shows stale data from 5 minutes ago. Is it a network issue? An API problem? Did your application crash? Or is it just Solana’s network congestion? Without proper insight into what happened or where everything went wrong, you’re flying blind — which, in crypto, equals losing money. What’s more, you need to make sure that you are notified if this issue repeats itself.
Most blockchain developers running their own nodes either to trade, to build onchain data or sell it as service need extensive monitoring.Their business depends on guaranteed uptime SLAs, data accuracy, and operational resilience.
Traditional monitoring doesn’t cover this problem well. That’s where an observability pipeline comes in. Observability means building your system in a way that exposes enough signals (metrics, logs, traces) so you can tell what’s happening inside just by looking at the outputs.
- Monitoring tells you “is the server up?” or “is CPU > 80%?”
- Observability tells you “why is my Solana feed five minutes behind?” or “did I miss messages during that network spike?”
The Solution: Real-Time Observability Pipeline
The answer to this problem is to monitor, trace, and track every step from a node ( or another data provider) to your database. Therefore, in this article, we will see how to build an observability pipeline that streams OHLC/K-line data + technical indicators (SMA/EMA) and USD volumes every second from Bitquery for both Solana and BSC. Here’s what makes it a good starting point:
- Real-time monitoring: Every message, error, and connection state is tracked
- Cross-chain comparison: Side-by-side visibility into how different chains vary in network statistics; Solana’s staggering ~3952 TPS vs BSC’s ~146 TPS
- Production resilience: Handles network blips, API rate limits, and sudden traffic spikes
- Open-source stack: OpenTelemetry + SigNoz for enterprise-grade monitoring without vendor lock-in
Complete sample code is available here
The main application code is in sub_test.py, and the commands needed to run the code are in the README file.
Why This Matters: The Observability Gap
- Data freshness: How old is your price feed really?
- Reliability: Are you missing critical updates during network congestion?
- Performance: How does your pipeline handle Solana’s 27x faster transaction rate vs BSC?
- Failures: When things break, how quickly can you detect and respond?
Observability bridges this gap, turning blind spots into actionable insights.
The Three Pillars of Observability: Metrics, Traces, and Logs
To understand observability and break it down into actionable tasks, you need to understand 3 things.
- Metrics:
- Metrics are numbers that quantify system performance and behavior over time
- In this scenario it would be:
- API response time (how long it takes to get price data)
- Data freshness (how old the latest price update is)
- Network latency to Solana RPC endpoints
- Number of failed API calls per minute
- Trading bot execution time per cycle
- Traces:
- Traces are detailed records of how requests flow through your system, showing the path and timing of each step
- In this scenario it would be:
- Request flow: User query → API call → Solana RPC → Price calculation → Dashboard update
- Each step shows timing and any errors
- Helps identify exactly where the 5-minute delay occurred
- Shows if the bottleneck is in API calls, network, or your application logic
- Logs:
- Logs are text records of events, errors, and activities that happen in your system
- In this scenario it would be:
- “API call to Solana RPC failed: connection timeout”
- “Price data received: SOL=$98.45 at 14:30:15”
- “Dashboard update completed in 2.3 seconds”
- “Network congestion detected: 150ms latency increase”
What is SigNoz, OTLP, and the OTel Collector?
- SigNoz: Open-source observability backend for metrics, traces, and logs. It provides dashboards, queries, and alerting. In this walkthrough we focus on metrics.
- OpenTelemetry (OTel): Vendor-agnostic SDK used by the app to create counters/histograms and export telemetry.
- OTLP: The OpenTelemetry Protocol (gRPC/HTTP) used to ship telemetry efficiently.
- OTel Collector: A service you run that receives OTLP(OpenTelemetry Protocol) from your app, batches/retries/transforms it, and forwards it to backends like SigNoz or any other observability tool.
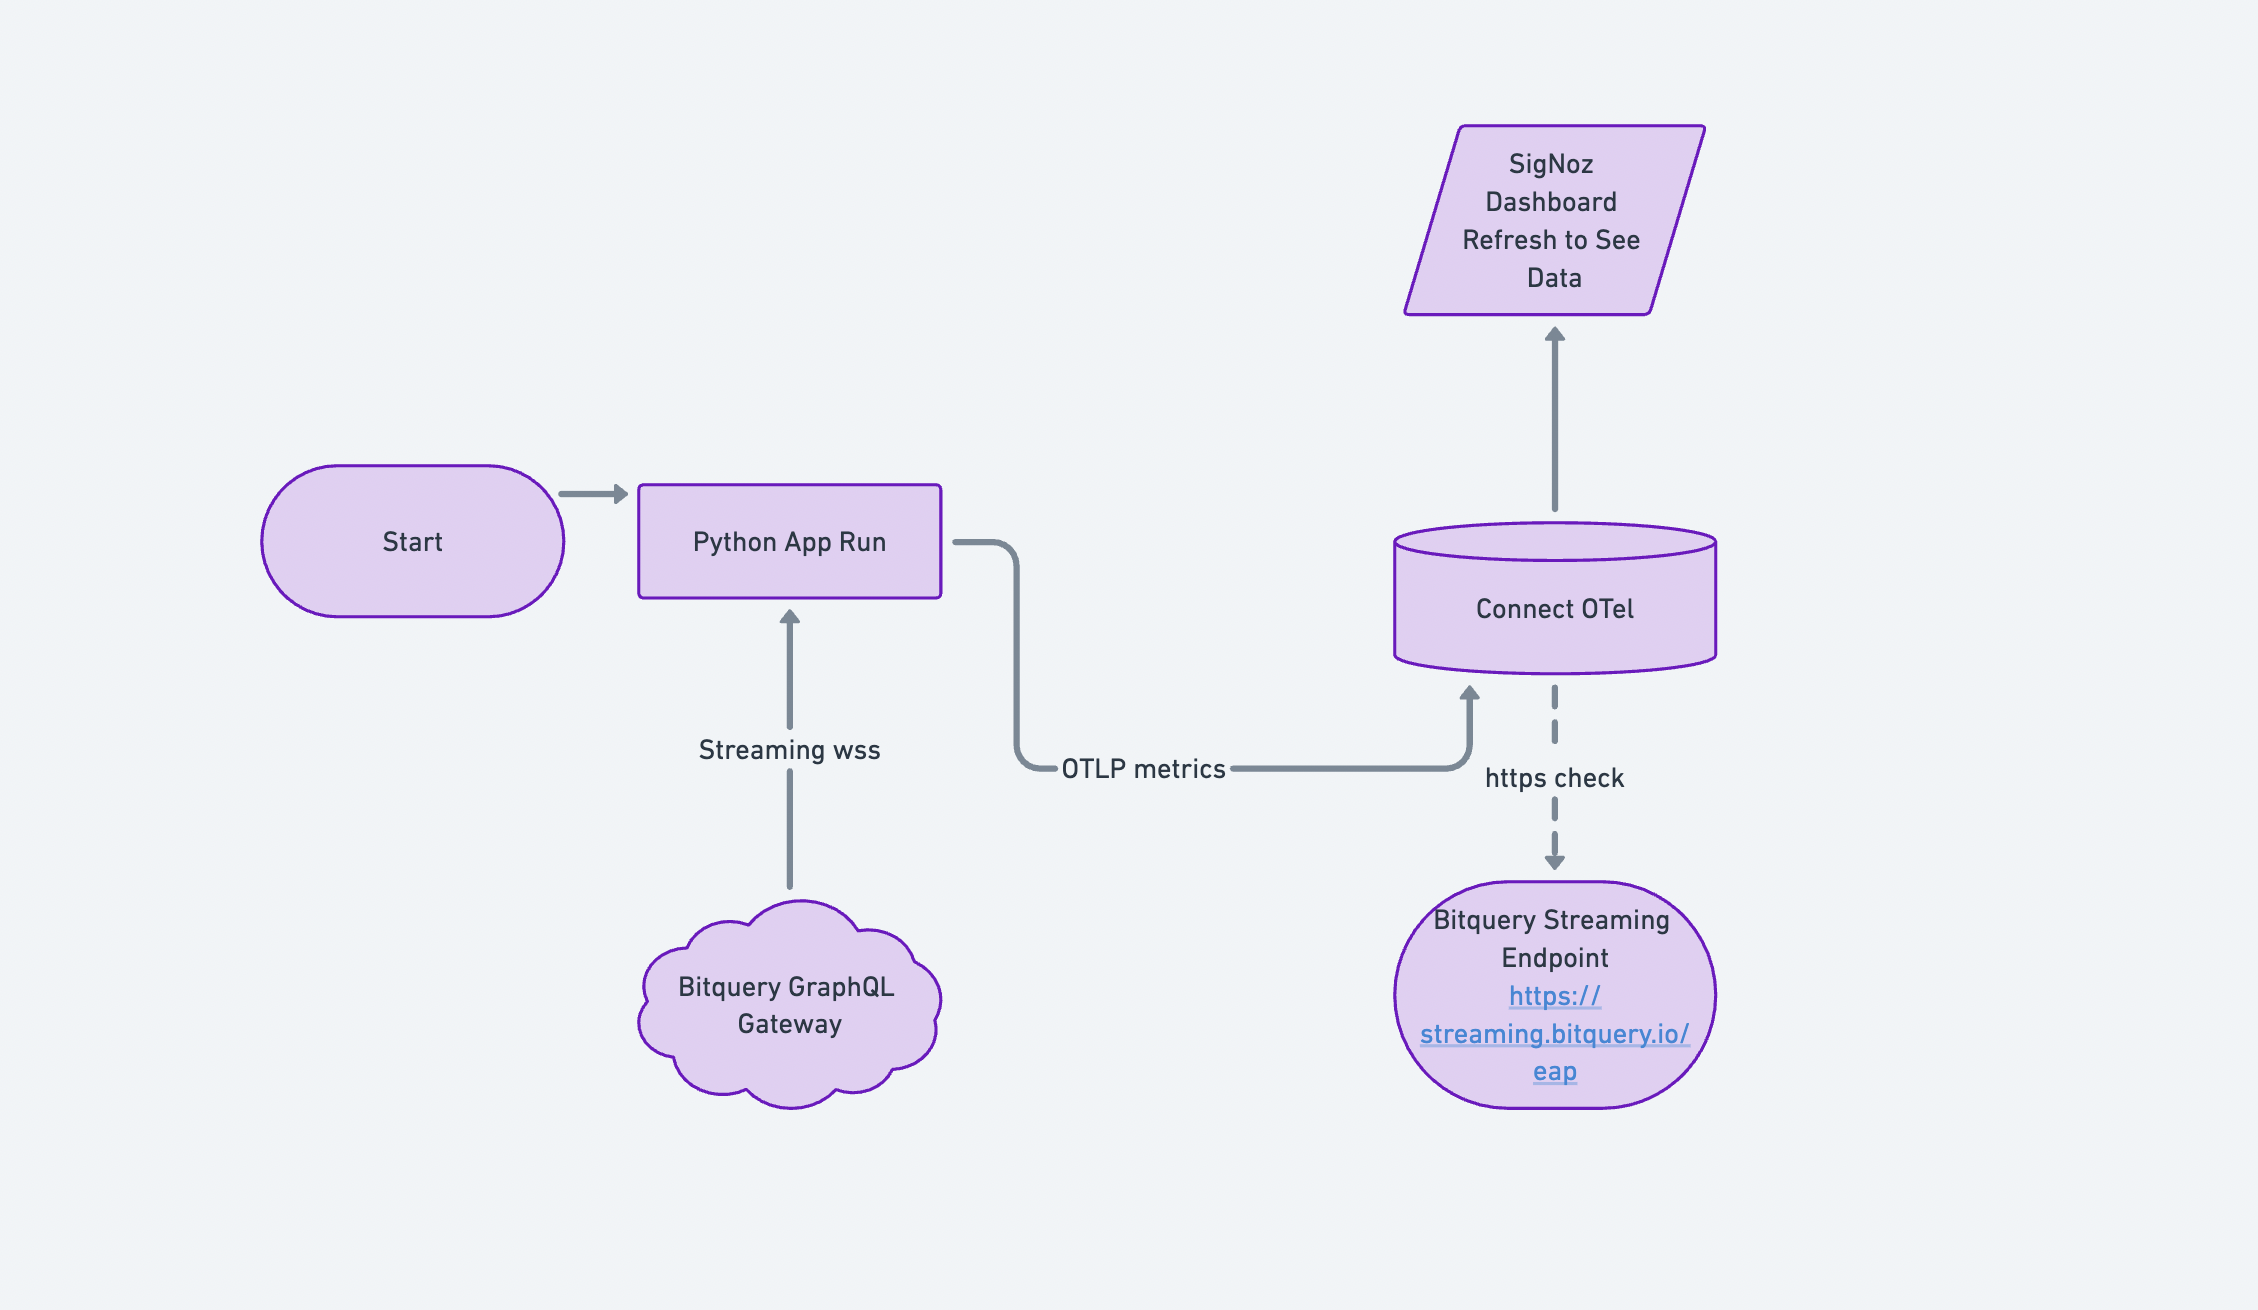
Flow: App (OTel SDK) → OTLP/gRPC → OTel Collector → SigNoz (OTLP endpoint with ingestion key).
How the Observability Pipeline Works: Step-by-Step Flow
Below is a detailed flow showing how data flows from your application through OpenTelemetry SDK to Signoz observability platform, including the configuration needed.
Data Source
- Bitquery GraphQL stream over WebSockets (1-second intervals). Read more on Bitquery Crypto Price APIs here
Ingestion App
- Python
asyncioconsumer (one dedicated subscription per network)
Telemetry Pipeline
- OpenTelemetry Metrics SDK → OTLP/gRPC → OTel Collector → SigNoz
Dashboards
- Message throughput
- Short-window rate increases
- Error spikes
- Connection health
With data ingestion working, the next step is to turn raw counters into usable metrics and dashboards. This is where OpenTelemetry and SigNoz come in.
Flow: App (OTel SDK) → OTLP/gRPC → OTel Collector → SigNoz (OTLP endpoint with ingestion key).
Setting Up Your Observability Stack: Step-by-Step Configuration
- Sign up for SigNoz.
- Obtain your OTLP endpoint and
signoz-ingestion-key— this key uniquely tags the metrics your application emits. Keep yourSIGNOZ_INGESTION_KEYsecret; inject via env vars or a secret manager. - Configure your OTel Collector to forward these metrics to SigNoz. Sample
config_sample.ymlis available in the repository.
How it’s monitored (driven by the code)
Our application, implemented in sub_test.py, exposes a set of metrics on message count, and errors that maps cleanly to dashboards and alerts. This is a sample that shows how to use an open source solution to monitor your solution that relies on onchain data.
Setting up Bitquery Price Streams
We will be using two graphQL streams; one for Solana and one for BSC. Run Stream on Bitquery IDE
- Solana Price Stream with 1-second OHLC
- Binance Smart Chain Stream with 1-second OHLC
Code sample to setup a websocket is here. The implementation in sub_test.py demonstrates how to connect to Bitquery’s WebSocket streams and handle subscriptions.
Metrics emitted
To first understand what metrics are available in the OpenTelemetry SDK, you can look it up here
Volume & Rate
bitquery.solana.messages(Counter)bitquery.bsc.messages(Counter)
Reliability
bitquery.solana.errors,bitquery.bsc.errors(Counter)bitquery.solana.connections,bitquery.bsc.connections(Counter)
Freshness probe (internal)
_last_msg_time[network]— used to detect stalls.
Why this works
- Separate counters per chain let us compare networks head-to-head.
- The generic counters with a
networkattribute power rolled-up views and per-network slices without duplicating widget logic. - Per-network transports and reconnect/backoff ensure one chain’s issues don’t hide the other’s in metrics.
Building Actionable Dashboards: What to Monitor and Why
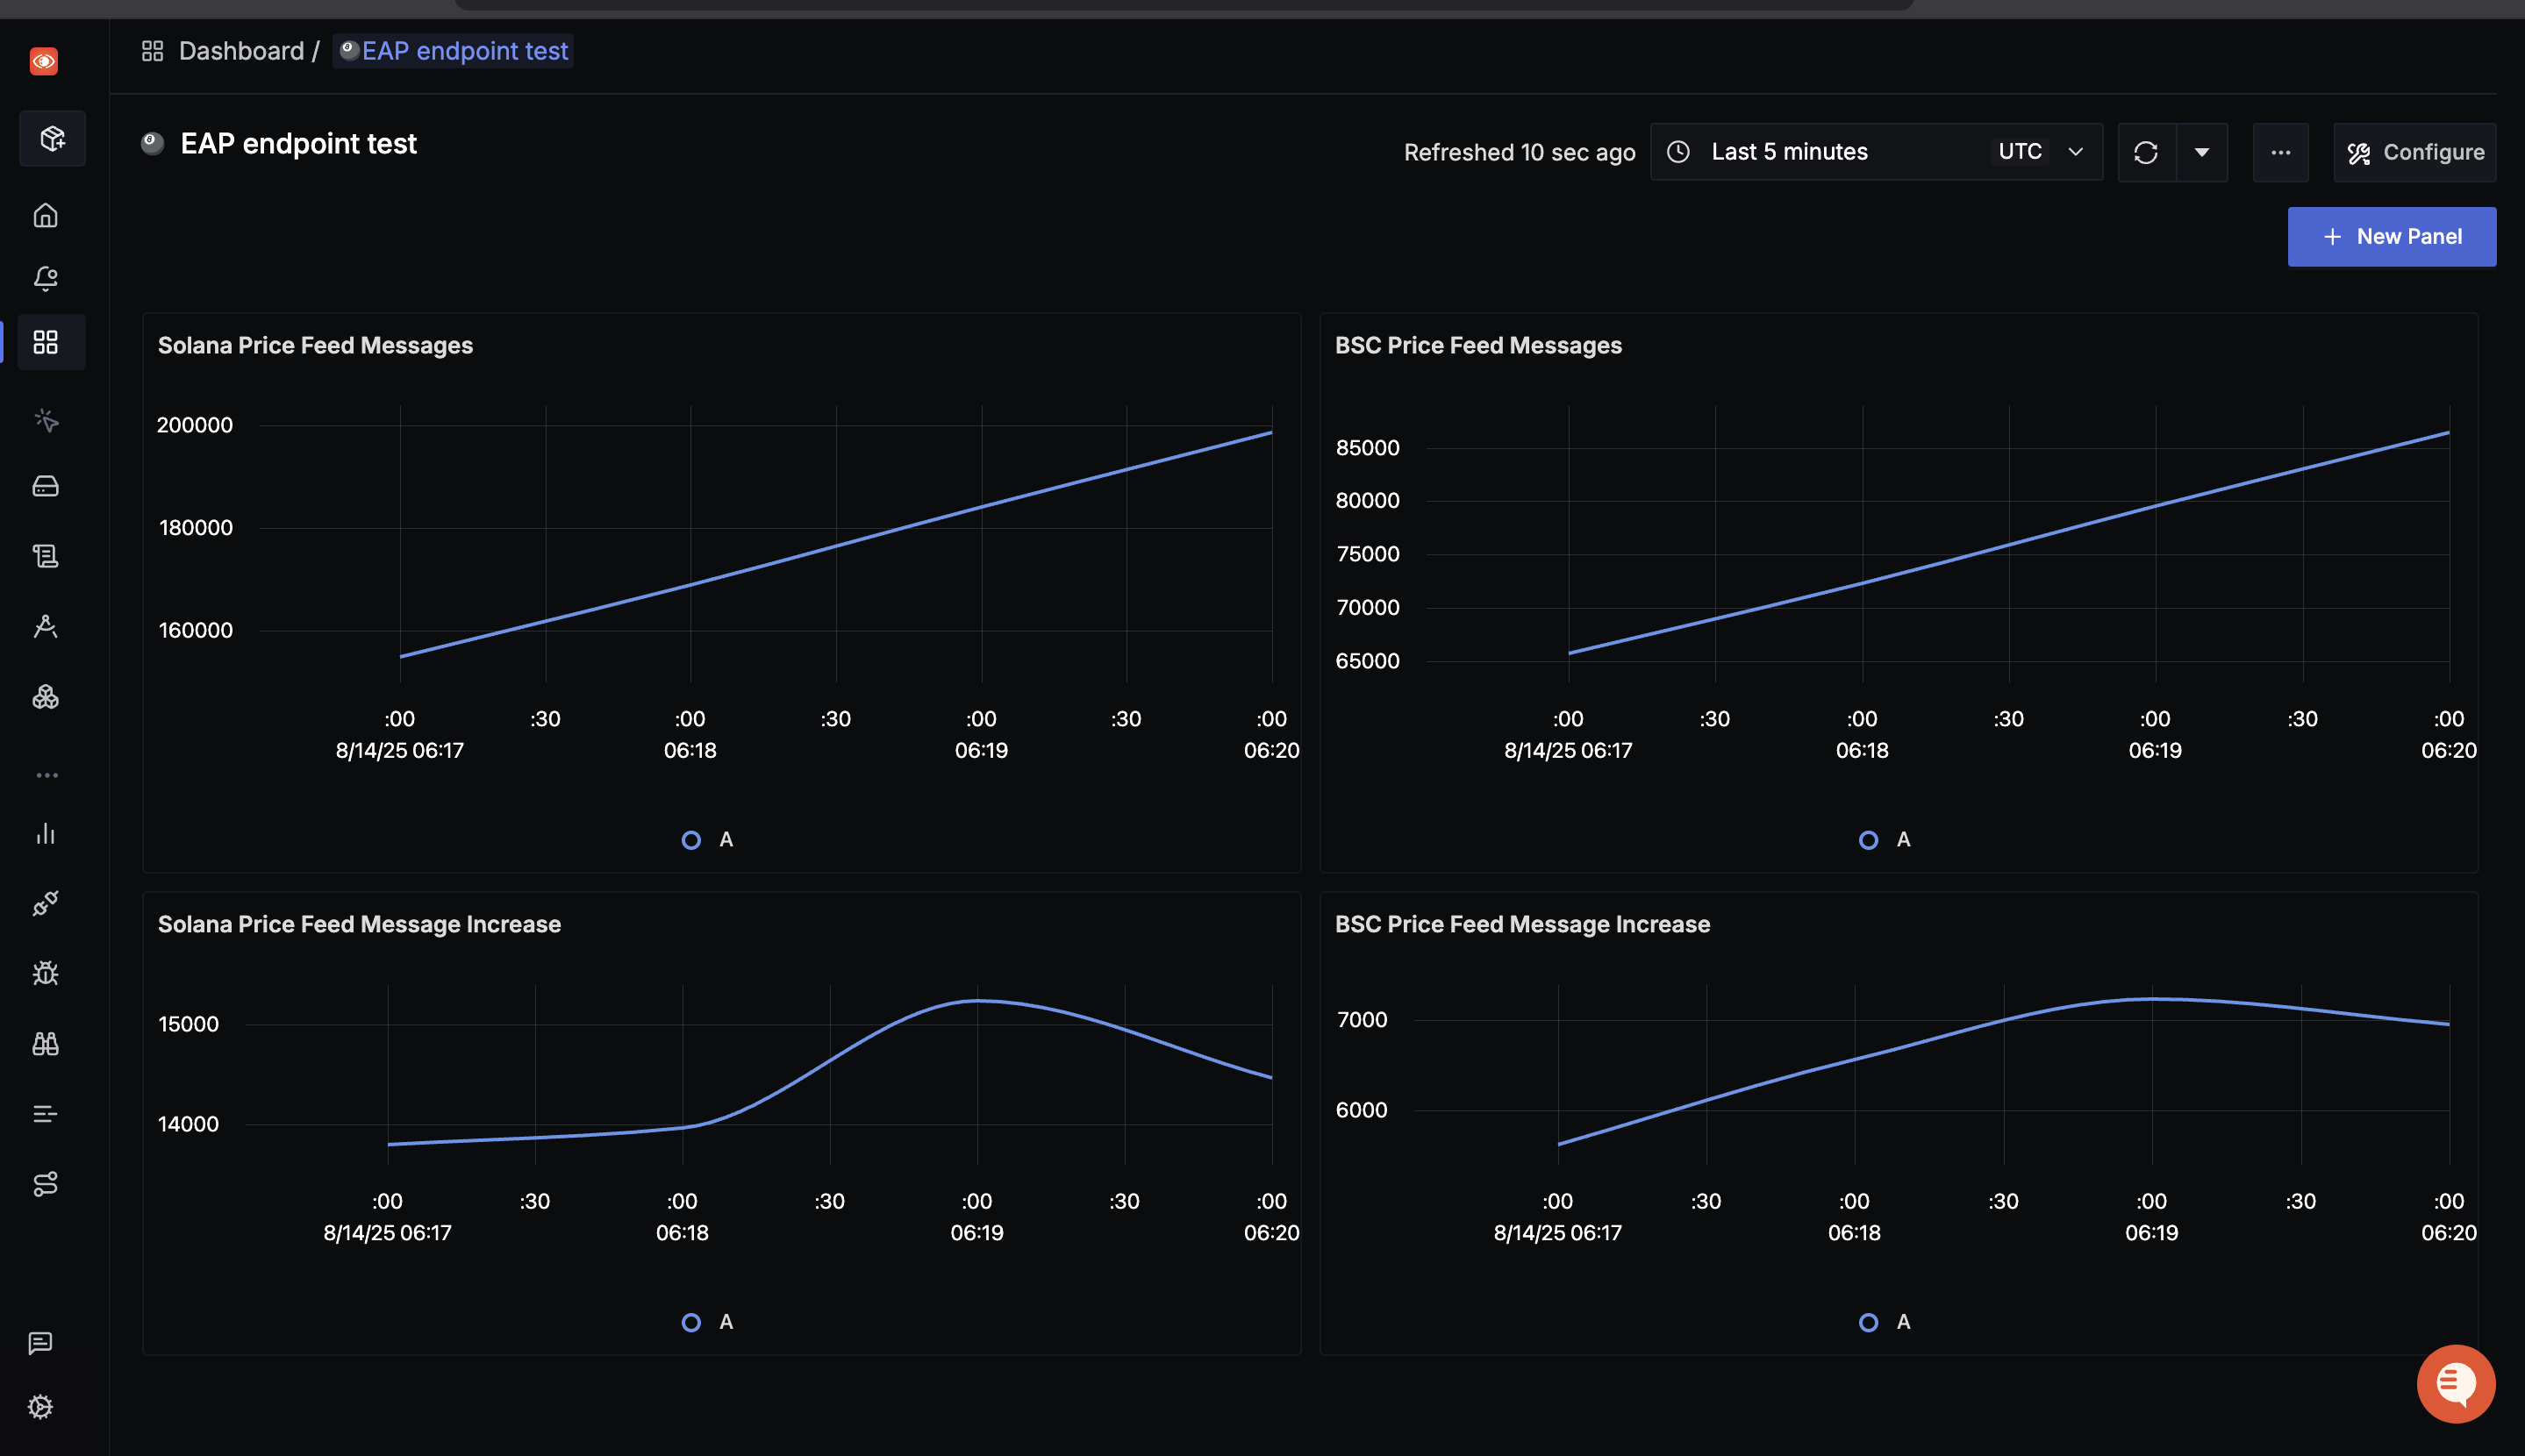
1) Price Feed Messages (5–10 min window)
Am I receiving the expected message rate from each chain?
- Panels: “Solana Price Feed Messages”, “BSC Price Feed Messages”
- Query: Sum of
bitquery.<network>.messagesover time (rate) - Interpretation: Slopes reflect throughput—Solana rises more steeply than BSC, matching TPS differences.
2) Message Increase (Short Window Burst View)
Did my pipeline keep up during a spike, or did it stall?
- Panels: “Solana Price Feed Message Increase”, “BSC Price Feed Message Increase”
- Query: Delta or increase of message counters per minute
- Interpretation: Spikes indicate bursts; flat lines suggest stalls or upstream pauses.
3) Reliability
Is the problem on my side, or is the provider/network unstable?
- Errors: Rate of
bitquery.<network>.errors - Connections: Cumulative
bitquery.<network>.connectionswith annotations when a reconnect occurs - Interpretation: Sudden error blips + reconnects correlate with gaps in the message panels.
4) Cross-Chain Comparison
Is this failure isolated to Solana as a result of high TPS, or does it affect both chains?
- Panel: “Messages by Network”
- Query:
sum(rate(bitquery.messages[1m])) by (network) - Interpretation: One panel, two lines—quick visual health check across chains.
Setting Up Smart Alerts: When and Why to Get Notified
To fix any out-of-the-normal situations, we need to setup alerts that are triggered based on certain conditions. Detailed docs on each type of alert is available here
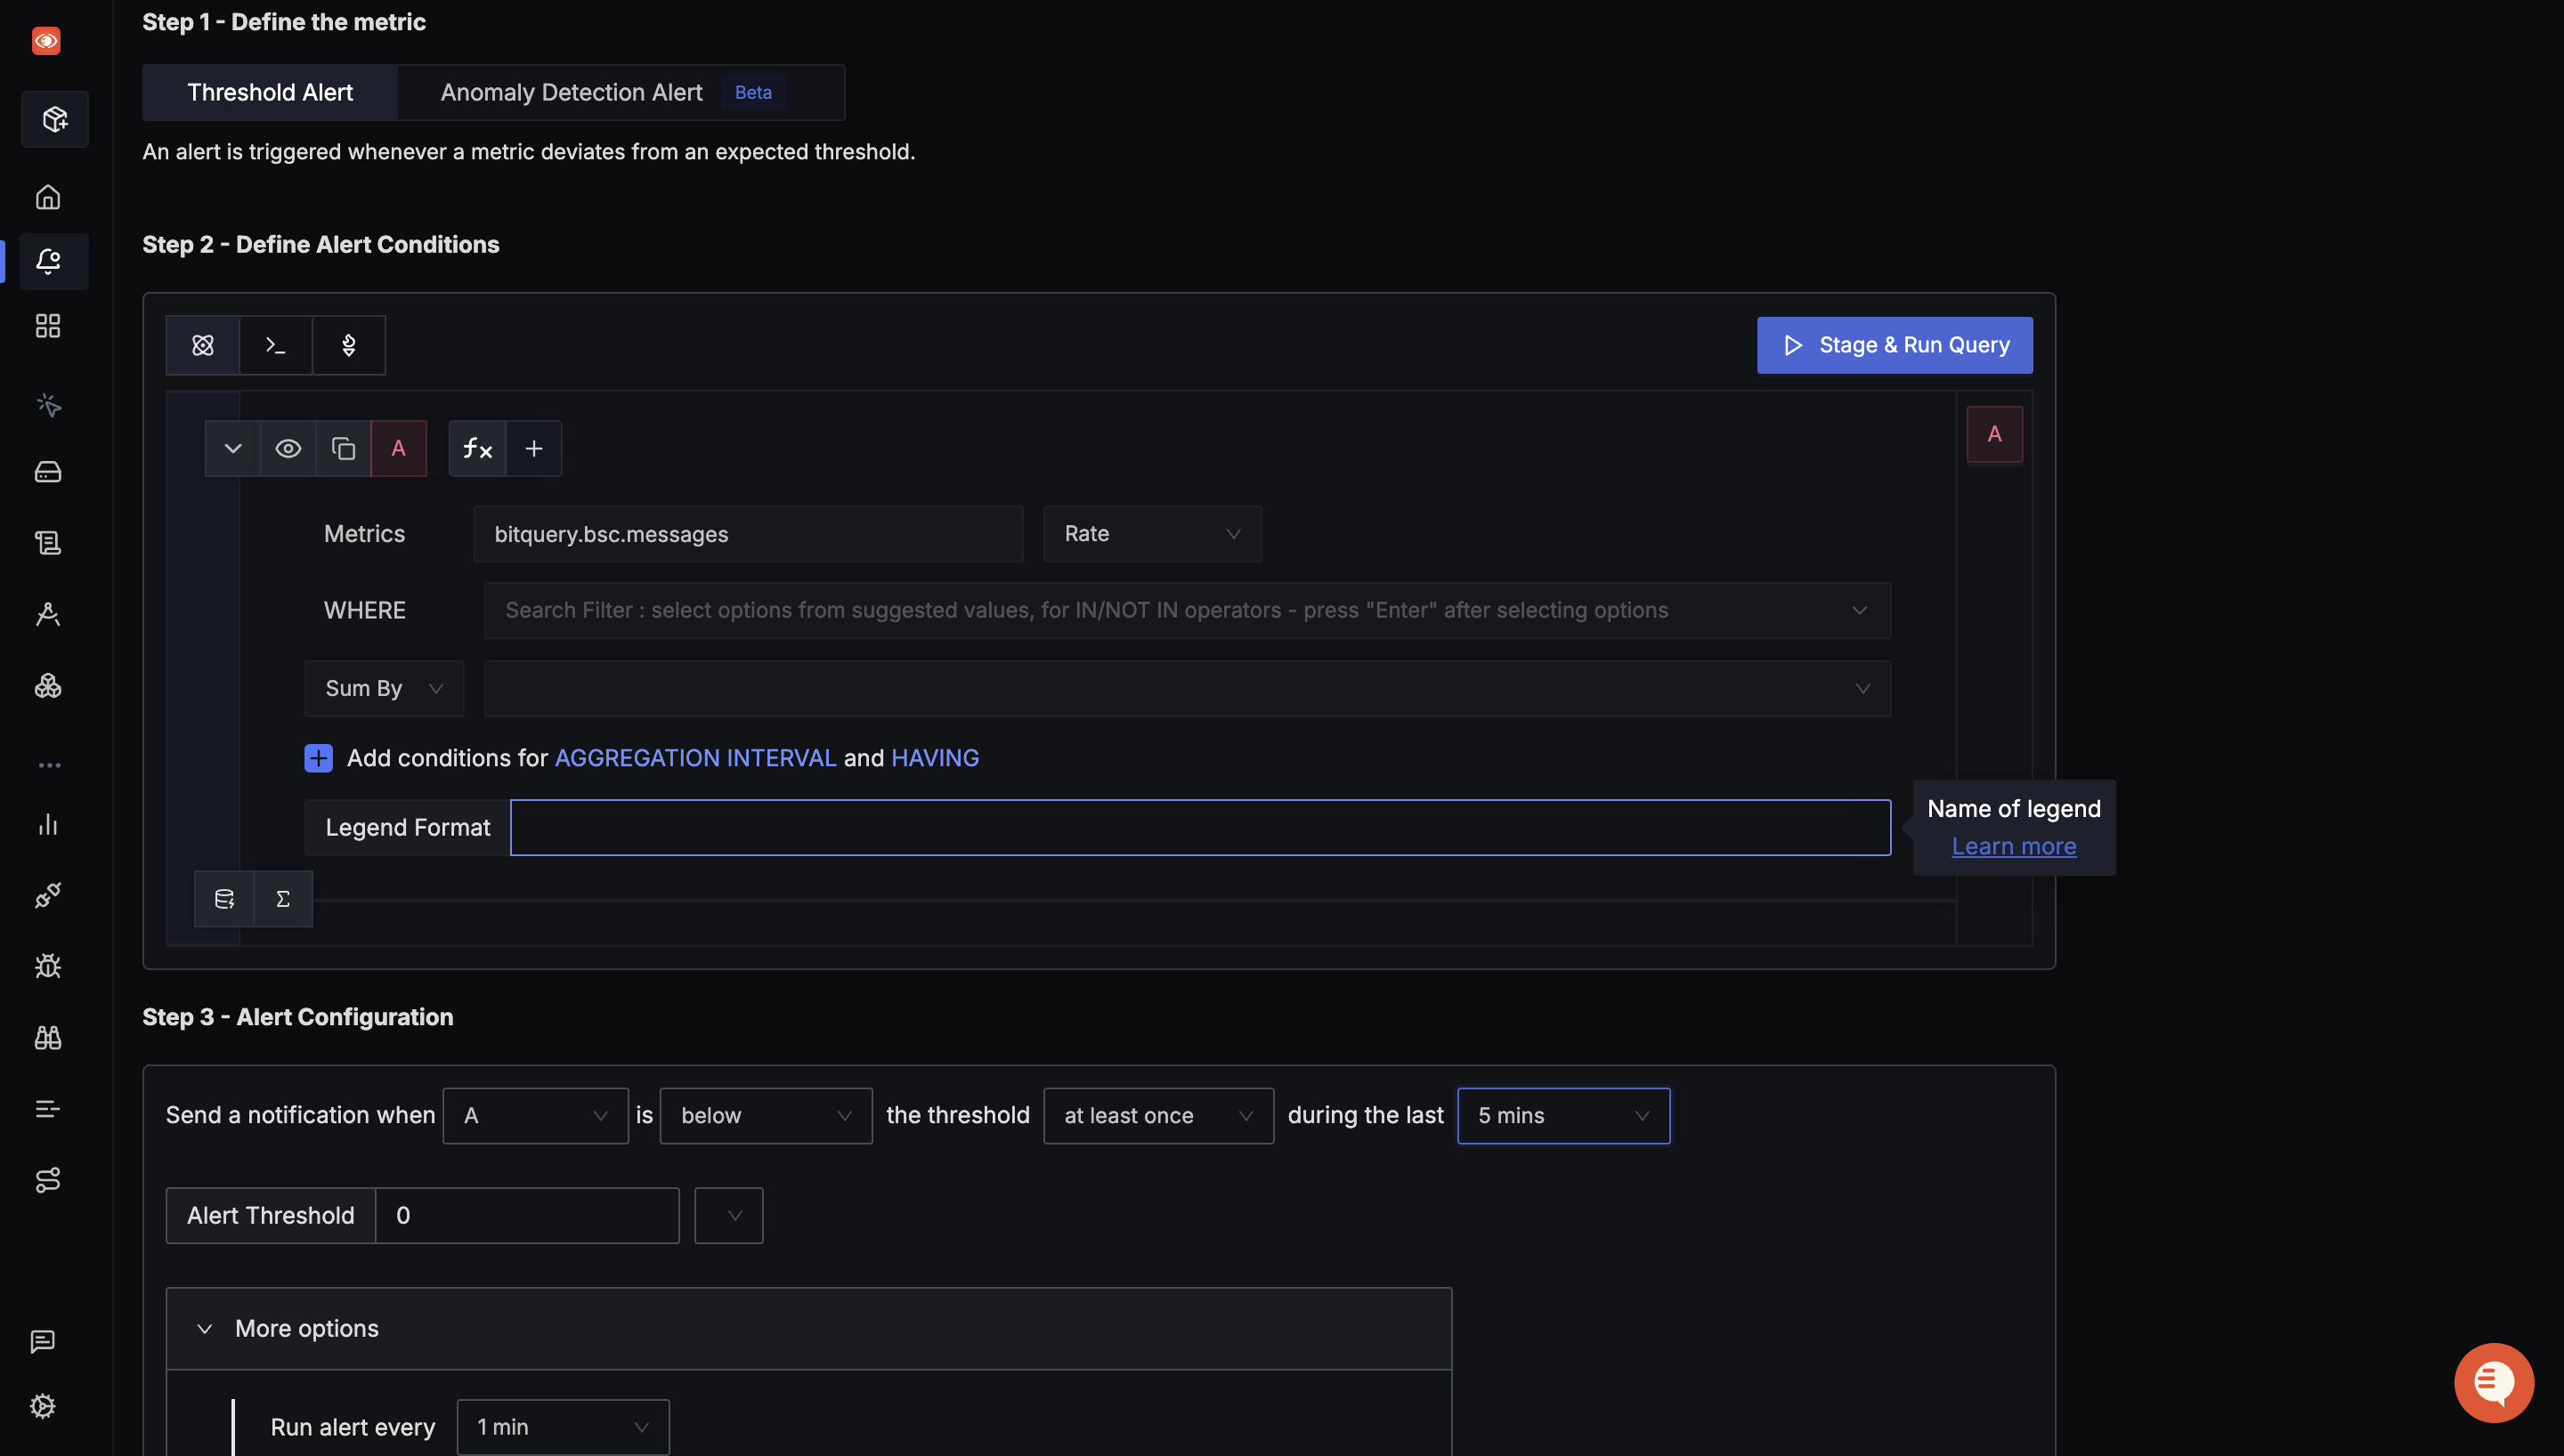
-
No new messages (freshness)
- Condition: increase of
bitquery.<network>.messages≤ 0 for 5 mins - Action: Page; annotate dashboard
- Condition: increase of
-
Error burst
- Condition: rate of
bitquery.<network>.errors> 0.5/s for 2 min - Action: Slack + issue
- Condition: rate of
-
Flapping connections
- Condition: delta of
bitquery.<network>.connections≥ 3 in 10 min - Action: Investigate upstream or network path
- Condition: delta of
These three cover data stops, bad data risk, and transport instability.
Operating it
The main application logic is in sub_test.py. Key implementation details:
- One task per network:
run_stream("Solana", query_solana)andrun_stream("Binance Smart Chain", query_bsc)keep pipelines independent. - Attributes: all generic counters include
attributes={"network": ...}enabling aggregated views and easy filters in SigNoz. - Graceful shutdown: Signals (
SIGINT/SIGTERM) flip anasyncio.Eventso the app closes WebSockets cleanly (you’ll see “Transport closed (…)” logs).
For installation and setup instructions, see the README and commands files. Dependencies are listed in requirements.txt.
Monitoring Post-Upgrade Network Health
Blockchain teams and governance members often vote on new improvements that improve transaction latency or propagation mechanism. For example, the recent Alpenglow upgrade on Solana introduces Rotor, a single-layer relayer system that replaces Turbine’s multi-hop block propagation. Rotor reduces propagation time and variability, so validators receive blocks almost simultaneously. For data teams, that translates to:
- Lower end-to-end lag from on-chain event → Bitquery → your consumer → dashboard
- More uniform message arrival (fewer jitter spikes), which steadies your “message increase” panels
- Fewer fork-induced anomalies, reducing short-term inconsistency in time-series derived from block data
Now how do we see the visual result? Expect smoother lines, quicker recovery after bursts, and fewer alert false positives tied to propagation delays.
What the charts told us
- Throughput reality: Solana’s message curve is consistently steeper than BSC’s, which matches the ~3952 vs ~146 TPS we calculated.
- Burst behavior: Even when the Solana feed spikes, the pipeline keeps up with it.
Final Thoughts
We started with a problem: trading bots running on stale data with no visibility into what’s happening. We’ve solved it with an observability pipeline that monitors the application’s blockchain data ingestion. For the onchain data that feeds these pipelines, see Using Onchain Trades to Identify Regime Changes and TRON Node Gossip Simulation.
What You Now Have:
- Real-time visibility into data freshness
- Cross-chain performance monitoring
- Automated error detection
- Production-ready infrastructure
Ready to Test: The complete codebase is available at GitHub.
Explore the code:
sub_test.py- Main application with WebSocket subscriptions and OpenTelemetry metricsREADME.md- Setup and installation instructionscommands.md- Quick reference for running the systemrequirements.txt- Python dependenciesconfig_sample.yml- OpenTelemetry Collector configuration
Questions? Issues? Contributions? Open an issue or PR on the repository.
Learn More
New to blockchain data? Check out the Beginner’s Guide to Blockchain Data: How to Get Started with the Basics ebook for a comprehensive introduction to working with onchain data, APIs, and building your first blockchain data pipelines.
Understanding Solana vs EVM differences? Explore the Solana vs EVM: Data Structures - Complete Guide ebook for a detailed breakdown of how Solana and EVM chains (Ethereum, BNB, etc.) differ in their transaction execution and data structures.